
Opioid deaths after 2016 CDC guideline
Prescriptions fell. Deaths kept climbing.
The 2016 CDC guideline reduced opioid prescribing. Opioid-involved overdose deaths went on rising for six more years, to nearly double the 2016 figure, before finally falling.
How many people died of opioid overdoses each year?
These are the counts of US drug overdose deaths involving opioids, from the National Center for Health Statistics provisional counts, on a 12-month-ending-December basis. All the years shown are reported as 100% complete.
| Year | Opioid-involved overdose deaths (US) | Change vs 2016 |
|---|---|---|
| 2015 | 33,203 | — |
| 2016 | 42,435 | baseline |
| 2018 | 47,096 | +11% |
| 2020 | 69,061 | +63% |
| 2022 (peak) | 82,851 | +95% |
| 2023 | 80,719 | +90% |
| 2024 | 55,007 | +30% |
| 2025 (provisional) | 45,008 | +6% |
The same divergence is visible at state level, where prescribing and mortality can be put on one set of axes. Missouri is shown here because its dispensing series runs the full period and its prescribing rate was among the highest in the country at the start of it.
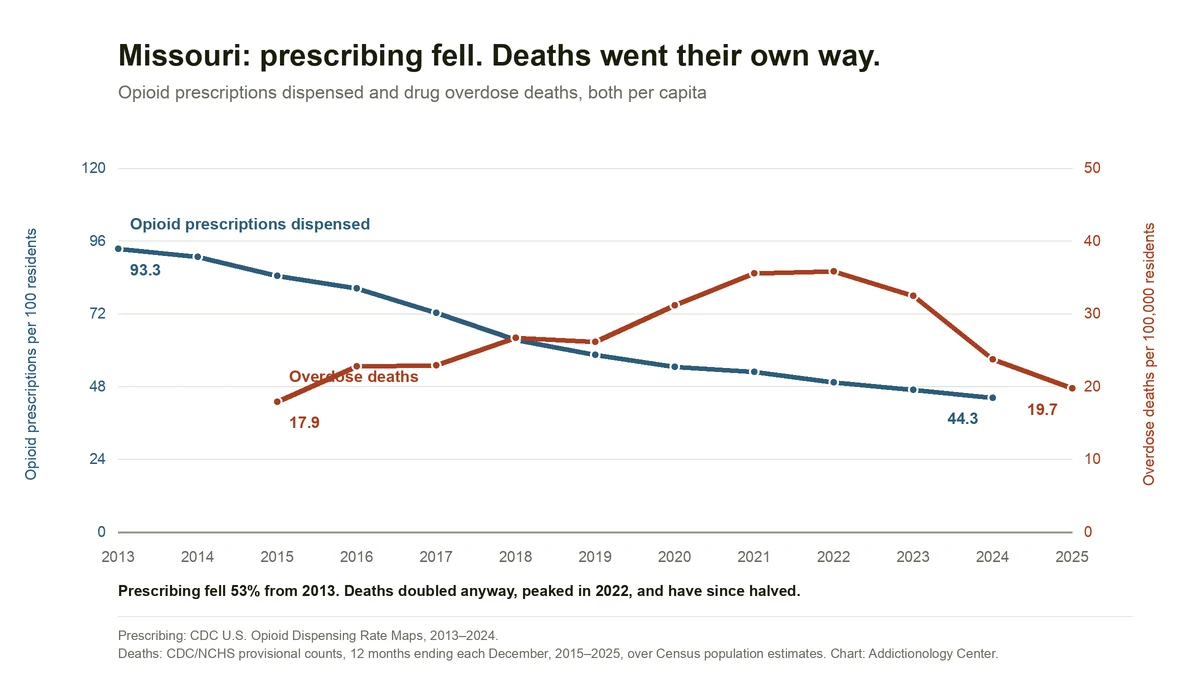
Missouri cut dispensing 53 percent between 2013 and 2024. Its overdose death rate roughly doubled over the same window, peaked in 2022, and then fell by nearly half while prescribing continued to decline. The two series cross in 2018. As above, this is co-movement described, not causation established: the fall after 2022 has candidate explanations — naloxone distribution, changes in the illicit supply, treatment access — that this page does not attempt to rank.
So the claim that opioid mortality “doubled” after the 2016 guideline needs stating carefully, and we state it carefully: opioid-involved overdose deaths rose 95% between 2016 and their 2022 peak — nearly double — and have since fallen substantially, with provisional 2024 counts at 55,007 and 2025 at 45,008.
We publish the decline as prominently as the rise. The 2023–2025 fall is real, it is large, and it is one of the few genuinely good pieces of news in twenty years of this. Its causes are still being argued over — naloxone distribution, changes in the illicit supply, treatment expansion, and the grim possibility of a depleted susceptible population are all on the table. What it does not appear to be is a delayed effect of prescription reduction, which had already largely happened by 2019.
What did the 2016 CDC guideline say, and how was it used?
The 2016 CDC guideline was written for primary care clinicians treating chronic pain outside active cancer treatment, palliative care and end-of-life care. Its recommendation 5 advised careful reassessment of benefits and risks before increasing to 50 morphine milligram equivalents per day or more, and generally avoiding increases to 90 or more.
It was then applied far beyond its scope. A study of federal and state opioid policy between 2016 and 2018 identified 527 opioid-related policies approved in that window, of which 170 specifically imposed limits on opioid prescribing and 35 specifically referred to or incorporated the CDC guideline. Guidance for one group of clinicians treating one class of patient became statutory and payer limits applied to specialists, to long-established patients, and in some cases to people at the end of their lives.
CDC revised the guideline in 2022, in part to address exactly this. The mechanism is covered on the prescribing guidelines page, and the consequences for patients are covered on the tapering and discontinuation page.
The inference, stated conservatively
Two things happened at once and it is easy to overclaim about the relationship. What can be said without overreaching is this: the policy instrument was aimed at prescription volume; prescription volume fell; the outcome the instrument was justified by — mortality — did not fall with it, and rose sharply for six more years. Whatever was driving mortality in that period was substantially not the thing being regulated.
That is not an argument for the pill mill era. It is an argument that the model of the problem was wrong, and that acting on a proxy while the real driver moves elsewhere is a specific, repeatable failure mode.
Questions this raises
Did the 2016 CDC guideline cause the increase in overdose deaths?
That is not a claim this site makes, and the data cannot support it. What the data show is that prescribing fell while opioid-involved mortality rose 95% to its 2022 peak, which means the driver of mortality in that period was largely not prescription volume. Attributing causation in either direction from population trends alone is not sound. See what population trends can and cannot tell you.
Why are opioid overdose deaths falling now?
It is genuinely unsettled. Widespread naloxone distribution, changes in the composition of the illicit supply, expanded treatment access, and changes in the size of the population at risk are all proposed. Anyone giving you a single confident answer is ahead of the evidence. Our note on the 2024 decline sets out the competing explanations.
What year had the most opioid overdose deaths?
2022. US opioid-involved overdose deaths reached 82,851 that year, 95% above the 2016 count of 42,435. The numbers then fell: 80,719 in 2023, 55,007 in 2024 and a provisional 45,008 in 2025. These are National Center for Health Statistics counts for the 12 months ending each December.
Did opioid prescribing go down after the 2016 CDC guideline?
Yes, and deaths did not follow it down. Missouri, one of the highest-prescribing states at the start, cut dispensing 53% between 2013 and 2024, from 93.3 to 44.3 prescriptions per 100 residents. Over the same years its overdose death rate roughly doubled, peaked in 2022, and then fell by nearly half while prescribing kept declining.
Did the 2016 CDC guideline apply to cancer or end-of-life patients?
No. The 2016 guideline was written for primary care clinicians treating chronic pain outside active cancer treatment, palliative care and end-of-life care. It was then applied far beyond that scope. Between 2016 and 2018, 170 federal and state policies imposed limits on opioid prescribing, and some of those limits reached specialists, long-established patients and people at the end of their lives.
Sources
Every figure on this page is traceable to the source listed here.
- National Center for Health Statistics. VSRR Provisional Drug Overdose Death Counts (dataset xkb8-kh2a), 12-month-ending counts for the United States. Data accessed 20 August 2026. View source.
- Duensing K, Twillman R, Ziegler S, Cepeda MS, Kern D, Salas M, Wedin G. An examination of state and federal opioid analgesic and continuing education policies: 2016–2018. J Pain Res. 2020;13:2431–2442. PMID 33061558. View source.